 |
 |
Left is always red, right is violet. Spectrum length varies according to picture. These are photos on black and white panchromatic film, which has a smoother response to most wavelengths. All wavelengths are nm[1][3].
These are various other metals that were scavenged from various sources. Sources are mentioned when available.
First, the spectrum of Cadmium. The material was scavenged from Ni-Cd batteries, but the lines are weak because of the low content of Cadmium in the metal.
|
|
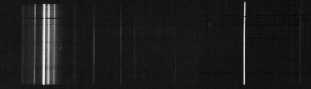
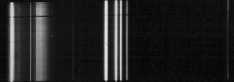
The spectrum of Lead comes next. This was a particularly hard one, because Lead melts easily. The electrodes were made by melting Lead into little pots, of 1.5 inch thickness. Then, two such barrels were used as electrodes. It turns out that only the hot spot of the arc was actually in a liquid condition[2]. Third line from the left is the 5895.70A. Fifth from left is the famous 5201A line. The strongest emission comes from the violet 4057.820A and 4019.64A lines. These two lines give the Lead discharge a mystical wonderful purple color. The line in the UV section (almost to the end of the photo right) is at 3683.71A.
 |
 |
The next spectrum is the spectrum of Silver. A clarification here: Pure Silver is really hard to find unless you work for a bank. The following spectrum, is labelled Silver, but as you can see from the spectrum, it contains lots of Copper. The most prominent line of Silver is the fourth line from the left, at 5465.487A.
 |
 |
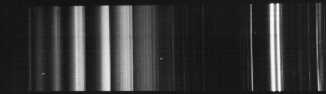
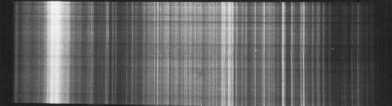
The next photo is the spectrum of Aluminum. Aluminum bars of half an inch thickness were used as electrodes. The discharge of Aluminum is particularly troublesome, because the material oxidizes badly while discharging, forming insulating salts (Alumina) which interrupt the discharge. Thus, one has to be really quick and photograph while the electrodes are still clean. Oxidation to Alumina forces cessation of the discharge in about 2 minutes. The first photo was taken while the arc was 2 mms in length. The second was taken with the arc flame being two inches in length. Note the molecular bands from various oxidations. The author is not sure exactly what caused molecular bands to appear. The only two lines that were listed were the lines (rightmost) at 3961.527A and 3944.032A.
 |
 |
 |
 |
The next spectrum is the spectrum of Tungsten. Mechanical high temperature Tungsten needles were used, bought from an electrode company that specialized in custom electrode materials for various uses. No effort has been made to identify any lines, because there are too many.
 |
 |
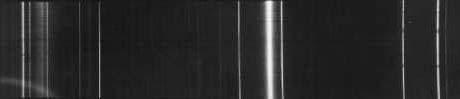
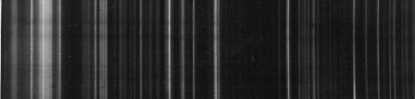
The next spectrum is that of Nickel. Electrodes were bought from that same company that made custom oven needles. The most prominent lines are at 4604.99A (first line of third triple cluster from left), at 4359.59A (third line of same cluster), 4288.01A (center of photo) and a UV band at 3962.12.
 |
 |
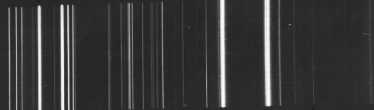
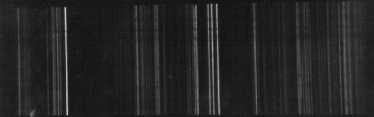
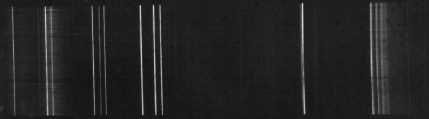
Next, the spectrum of Cobalt. Left most prominent is at 5353.49A (second cluster from left), 4693.21A and 4594.63A/4553.33A (third cluster from left), the doublet 4359.43A/4357.17A left of the triplet, the triplet itself at 4303.24A/4252.31A/4242.26A and then the violets 4077.41A and 4045.39A (third cluster from right), the violet quadruplet at 4035.55A, 4023.40A, 4020.91A and 4019.30A and then a UV quadruplet at 3969.12A, 3961.00A, 3945.33A and 3933.91A (first band from the left).
 |
 |
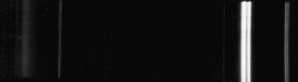
Next, the spectrum of Zinc. Old battery shells were used as electrodes (easy to find) and the discharge was particularly interesting. It had a beautiful pink color, the pink that comes from mixing red and blue (magenta). The Zinc lines are fairly famous. They are the red 6362.347A (first to the left) and the blue triplet (actually quadruplet as you can see below) 4810.554A, 4722.159A and 4680.138A.
 |
 |
The last spectrum is a weird mixture they used to use for kitchen utensils. It contains Zn and Cu. It's not used anymore because it leaves a green residue after use which is poisonous.
 |
 |