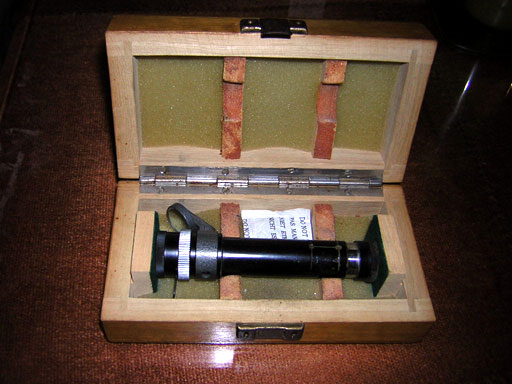
The hand-held spectroscope which the author's Father bought contains a slit which can be adjusted using the graded metal ring on the left, a convergent lens and a double Amici prism. Focusing is accommodated using a retractable second tube. It also has a mirror and a second entry point, just in case the user wants to compare two different spectra directly.
The double Amici prism (also known as double wedge prism), usually found inside direct-vision hand spectroscopes, works roughly as follows:
To analyze the prism's behavior, we have to look at the prism's optical trace diagram:
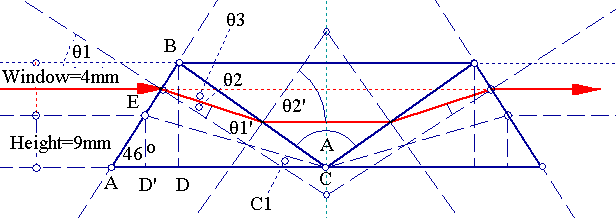
The main dimensions of the prism are:
AC=21mm
AB=12.511472mm
DC=12.308801mm
BD=9mm
Now we will try to find the refraction indexes of the three prisms.
ED'=5mm since the optical window is 4mm.
ED'/AD'=tan(46°)=>AD'=ED'/tan(46°)=5/tan(46°)=>AD'=4.8284439mm.
=> D'C=21-4.8284439=>D'C=16.171556mm.
=>tan(C1)=5mm/16.171556mm=>C1=17.180816°.
But C1=θ3=θ1-θ2 (1) and
θ1=44°, then
sin(θ1)/sin(θ2)=nB
=>sin(θ2)=sin(θ1)/nB=>θ2=sin-1{sin(44°)/nB}
(2)
(1)(2)=>44°-sin-1{sin(44°)/nB}=17.180816°=>sin-1{sin(44°)/nB}=44°-17.180816°
=>sin-1{sin(44°)/nB}=26.819184°=>
nB=1.5396603~1.54
=>Material is close to BaK2. So outer prisms are probably made by BaK2.
Now for the inner prism:
the formula for minimum deviation for the inner prism gives:
sin{(2*θ3+A)/2}/sin{A/2}=nA/1.54 since total deflection is 2*θ3.
=>sin{θ3+A/2}/sin{A/2}=nA/1.54=>nA=1.54*sin{θ3+A/2}/sin{A/2}=>
nA=1.54*sin{44°-sin-1(sin(44°)/1.54)+53.82631°}/sin(53.82631°)=>
nA=1.806246683~1.806
This is very close to LaSFN9, but not quite.
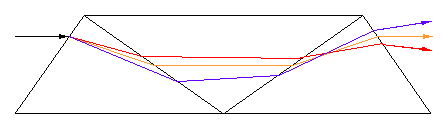
If you look at the first figure, you will notice that the three prisms act alternatively on a ray of light. I.e., prism 1 resolves, prism 2 unresolves, prism 3 resolves. So we would expect the resolving power to be the direct sum of the components.
λ/Δλ=|B1*dn1/dλ+B3*dn3/dλ-B2*dn2/dλ|=|B2*dn2/dλ-2*B1*dn1/dλ|
We know that B1=B3=21mm and B2=24.617602mm, and
|dn1/dλ|=|dn3/dλ|=3.9473*10-6 (BaK2)
so with |dn2/dλ|=8.5*10-6 (LaSFN9) =>
|λ/Δλ|=434.63.
Accordingly then: Δλ=λ/434.63=>Δλ=5790.7A/434.63=>
Δλ=13.32A.
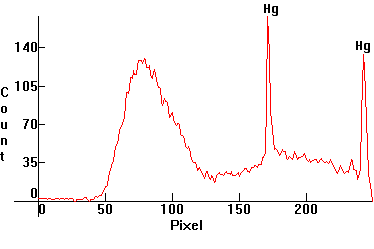
As it turns out this is roughly correct, since visually this spectroscope marginally resolves the yellow mercury doublet, with a respective difference of Δλ=5790.7A-5769.6A=21.1A. This resolving of the mercury yellow doublet is not visible in the photos below because of limited camera resolution.
Note that we do not know dn2/dλ, because we do not know the material for the middle prism.
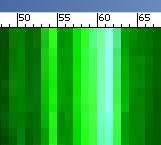
Here are some spectra of common light sources, photographed through the hand-held spectroscope and a Nikon CoolPix digital camera and processed with Photoshop, MW Snap 3 and Iris. These are REAL photos of spectra, not artificial simulations. The collection below was based on roughly 1,200 different photo samples out of which the author selected and processed the best. Data correction and verification for column one, courtesy of Maxime F. Gendre. CRI verification for column one, courtesy of Don Klipstein. Actual nm table courtesy of Mark Widmer. This page is optimized for use with Internet Explorer. The author has recently changed the numbering of all spectra from absolute to relative, to allow for further spectrum additions without having to renumber all the spectra past the additions. The author will be adding more spectra as time allows and make corrections, so make sure you reload this page every time. The accuracy of the data on this page depends heavily upon the author's camera's color sensor sensitivity, therefore it is advisable to read the author's Copyright & Disclaimer before perusing any of the data below. Also note that this document is fairly old (created in 2010) and excludes many developments in LED technology used today (2020 as of the latest writing).
| Light Type | Visible Spectrum | Spectral Distribution |
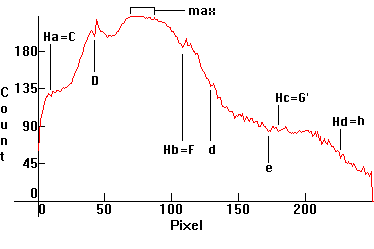
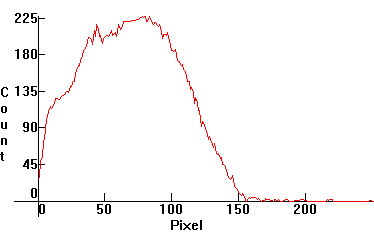
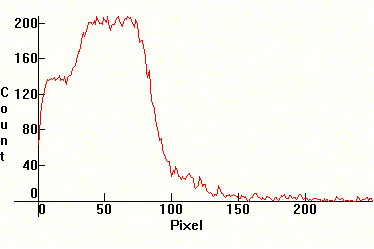
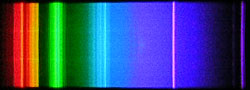
| [1.1.1]: Natural daylight. Black body @ 5,785K. Efficiency[1]: 93-98 lm/W. CRI: 100. Several Fraunhoffer absorption lines are visible. The distribution to the right displays the maximum intensity of emission occurring between 504nm and 527nm, which is quite close to 501nm, the actual wavelength at which the maximum emission occurs for a black body of temperature 5,785K (Note that the this means that around that area, the spectroscope is roughly correctly calibrated for intensity, as we shall see in section Intensity Calibration). Calibration relative to [1.5.3] (Sodium D line). | 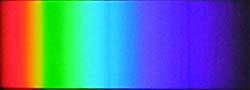 |
 |
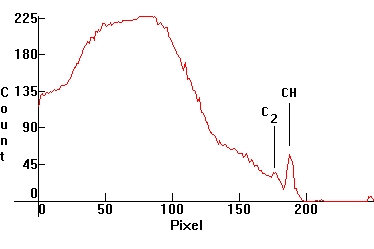
| [1.2.1]: Paraffin candle flame. Black body @ 1,020K and CH and C2 molecular bands from paraffin. CRI: 98. Compare with [1.10.1]-[1.10.2]. Calibration relative to [1.10.1]. | 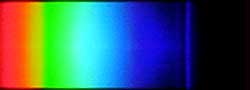 |
 |
| [1.2.2]: 7W incandescent lamp, generic. Black body @ ~ 2,800K. Efficiency: 10 lm/W. CRI: 99. Considered the best choice for indoor lighting. Calibration approximate. | 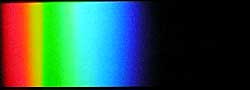 |
 |
| [1.2.3]: 200W incandescent lamp, from PHILIPS [Argenta]. Black body @ ~ 2,800K. Efficiency: 12-18 lm/W. CRI: 100. Considered the best choice for indoor lighting, with soft tones and warmer appearance. Note that as temperature increases, blue emissions increase, as the peak of the black body distribution curve moves to the right. Calibration relative to [1.2.2]. |  |
 |
| [1.2.4]: A modern (without Thorium) Welsbach gas mantle from a camping gas lantern @ ~1,000 C. CRI: 95. The original gas mantles used oxides of thorium and cerium, but since thorium is radioactive modern mantles use various other elements, such as yttrium and/or zirconium, as a result they are not as efficient. Welsbach gas mantles were used on newsstands, kiosks and stand-alone selling places, but eventually were made obsolete and are now used only in camping gas lanterns. Calibration relative to [1.2.2]. | 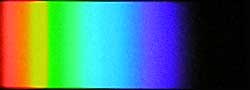 |
 |
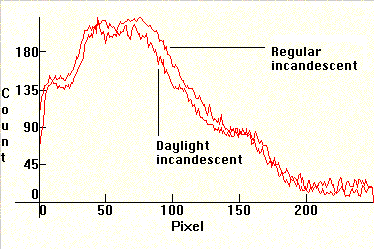
| [1.2.5]: Direct spectral comparison (using calibration by visual inspection) of a regular incandescent (above) and the less known blue-glass "daylight" incandescent (below), of equal power. Both are black body radiators @ ~ 2,800K, but the blue glass on the second lamp absorbs part of the excess red and yellow radiation and thus raises the overall color temperature to ~ 4,000K. Efficiency: 12-18 lm/W. CRI: 100. These lamps are predominantly used in design and architectural studios for color matching when a cheap "daylight" source is needed, since they do not require any support gear. Calibration relative to [1.2.3]. | 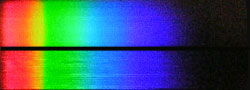 |
 |
| [1.2.6]: Incandescent anti-insect lamp. This is an incandescent lamp which uses a yellow colored filter to block all radiation below green. The spectrum of this lamp exerts less attraction (but not no-attraction!) for most insects than light of other colors, consequently these lamps are used in garden parties, patios, camps, road stands, service stations, etc (Technically this is an absorption spectrum, but has been put here because the yellow filter is incorporated with the lamp). Color temperature @ ~ 2,000K. Efficiency: 12-18 lm/W. Calibration relative to [1.2.5]. | 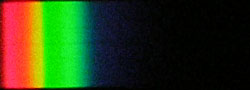 |
 |
| [1.3.1]: Regular daylight fluorescent, from PHILIPS [TL-D 30W/55]. These lamps have a good color rendering approximating the quality of daylight, but only when they are used uniformly in large numbers for the illumination of larger spaces. Used individually they distort colors and many people complain that their light is way too cool. Note the decreased phosphor emissions in the red-yellow area relative to [1.3.2]. Mercury and calcium halophosphate (activated with bismuth and manganese) phosphors, utilizing the 254nm Mercury line. Color temperature @ ~ 5,500K. Efficiency: 60-65 lm/W. CRI: 76. Calibration relative to [1.13.1]. | 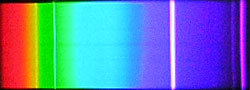 |
 |
| [1.3.2]: Regular warm white fluorescent, from Sylvania [F4T5 4W]. Sometimes used in place of [1.3.1], as these lamps have a warmer color quality. They can also be used individually because of their warmer color. Note the warmer phosphor emissions. Mercury and calcium halophosphate (activated with bismuth and manganese) phosphors, utilizing the 254nm Mercury line. Color temperature @ ~ 3,700K. Efficiency: 70-75 lm/W. CRI: 51. Calibration relative to [1.13.1]. | 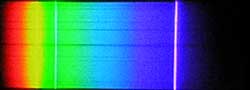 |
 |
| [1.3.3]: Regular Compact Triphosphor fluorescent (CFL), from OSRAM [DULUXSTAR 21W/827]. Most types of CFL's used in homes and shops are of this kind. They have become very popular lately because of their excellent efficiency and good color rendering, which resembles the warmer appearance of incandescent lamps, but people have complained that their spectrum is too sparse, giving them headaches (details here). Mercury, and bicomponent europium and terbium phosphors, utilizing many of the Mercury lines. Color temperature @ ~ 2,700K. Efficiency: 65 lm/W. CRI: 82. Calibration relative to [1.13.1]. |  |
 |
| [1.3.4]: Cold cathode warm white CFL Triphosphor fluorescent. From a 2.5W USB desktop light used for desktop reading and writing. These lamps are more balanced chromatically than [1.3.3], making them quite comfortable for reading/writing. Mercury, and tricomponent europium and terbium phosphors, utilizing many of the Mercury lines. Color temperature @ ~ 4,000K. Efficiency: 75 lm/W. CRI: 86. Calibration relative to [1.13.1]. (For more detailed photos of this spectrum, click here) | 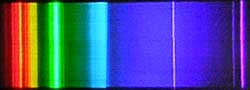 |
 |
| [1.3.5]: Daylight CFL Triphosphor fluorescent, from NARVA [COLOURLUX plus daylight 20W/860]. These are CFL's with a cooler color, approaching the quality of daylight. They have become popular but are not as popular as the warmer CFL's, above, because people consider their color way too cool and bright for indoor use. Slightly overexposed to show the increased phosphor emissions which peak around ~450nm in the blue. Few companies manufacture these. Mercury, and tricomponent europium and terbium phosphors, utilizing many of the Mercury lines. Color temperature @ ~ 6,000K. Efficiency: 60 lm/W. CRI: 82-86. Calibration relative to [1.13.1]. |  |
 |
| [1.3.6]: GroLux fluorescent aquarium and plant illumination lamp from Sylvania. These are fluorescent lamps which use magnesium germanate phosphors for red and barium aluminate phosphors for blue (according to Jeff Waymouth), (instead of halophosphate phosphors or triphosphors) which utilize the 365nm Mercury line instead of the 254nm line and are used for the illumination of aquariums and plants. Note partial coincidence of the phosphor peaks with those of [1.4.2]. Calibration relative to [1.13.1]. | 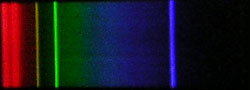 |
 |
| [1.3.7]: A Compaq Presario 2100 laptop's Liquid Crystal Display screen. Laptop backlit LCD screens usually employ a cold cathode electronic CFL, like [1.3.4]. Compare with [1.3.3]/[1.3.4]/[1.3.5]. Color temperature @ ~ 4,000K. Efficiency: 75 lm/W. CRI: 86. Calibration relative to [1.13.1]. | 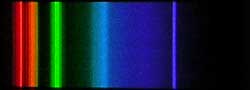 |
 |
|
[1.3.8]: The new PHILIPS ActiViva "Natural" triphosphor
fluorescent, with 25% more blue light than cool daylight fluorescents
[1.3.1]. This lamp is the result of the
latest research done by PHILIPS on people's response to light. The
manufacturer claims (*) that this lamp and [1.3.9] caused people to increase their work
performance and made them feel better overall. Color temperature @ ~
8,000K. Efficiency: 68.7
lm/W. CRI: 82. Calibration relative to
[1.13.1].
(*) The author agrees with these claims. |
 |
 |
| [1.3.9]: The new PHILIPS ActiViva "Active" triphosphor fluorescent, with 85% more blue light than cool daylight fluorescents [1.3.1]. This lamp is also the result of the latest research done by PHILIPS on people's response to light. PHILIPS makes similar claims for this lamp as for [1.3.8]. The additional amount of blue light on this and on [1.3.8] comes as a result of altering (upping) the ratio of the blue component in tricomponent terbium/europium phosphors. This difference becomes evident when you look at the counts of the corresponding distributions. Color temperature @ ~ 17,000K. Efficiency: 68.7 lm/W. CRI: 82. Calibration relative to [1.13.1]. | 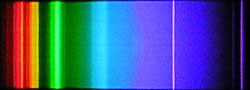 |
 |
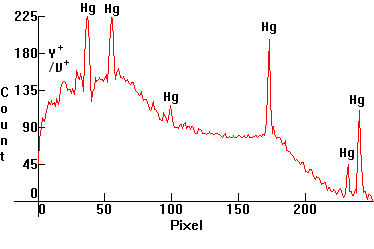
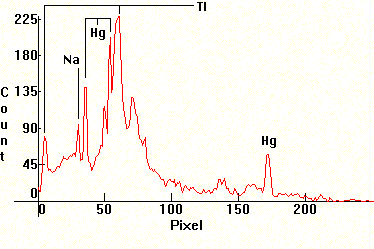
| [1.4.1]: Clear High Pressure Mercury lamp, from OSRAM [HQA 80W]. These lamps were originally used for highway and street lighting, both in the States and Europe, but they are now used mostly for back door porch security lighting in the United States. In Europe they have been mostly decommissioned and have been replaced with more efficient lamps, such as [1.4.3] and [1.5.5]. Note significant thermal broadening of lines and increased continuum from partial ionization. Also note almost complete lack of red emissions. Color temperature @ ~ 7,200K. Efficiency: 52 lm/W. CRI: 20. Calibration relative to [1.13.1]. | 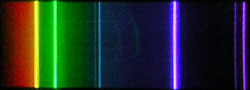 |
 |
| [1.4.2]: High Pressure Mercury lamp with improved color, the inner side of the lamp's bulb containing color improving fluorescent magnesium arsenate (activated with manganese) phosphors utilizing the 313nm and 365nm Mercury lines (and peaking around 650nm), from PHILIPS [HPL 125W]. Lamps with these older phosphors were used around 1965-71 in Europe for highway and street lighting, but eventually were replaced by lamps with yttrium vanadate phosphors, below. Variations of these with magnesium germanate phosphors were being used in the States till 1984. Color temperature @ ~ 4,700K. Efficiency: 40 lm/W. CRI: 28. Calibration relative to [1.4.1]. | 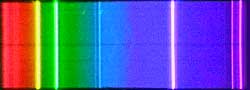 |
 |
| [1.4.3]: High Pressure Mercury lamp with improved warm deluxe color, the inner side of the lamp's bulb containing color improving yttrium vanadate phosphate phosphors utilizing many UV Mercury lines (and peaking around 611nm), from OSRAM [HQL 80W]. Color temperature @ ~ 4,200K. Efficiency: 58 lm/W. CRI: 49. These lamps are still used for highway and street lighting in Europe and the United States, but are gradually being replaced by more efficient lamps such as [1.5.5]. Calibration relative to [1.4.1]. | 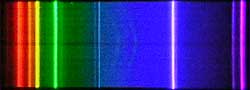 |
 |
| [1.4.4]: Self-Ballasted High Pressure Mercury vapor lamp containing an incandescent filament in series with the Mercury discharge tube, which acts both as a black body emitter @ ~2,500K and as a resistor, from PHILIPS [ML 160W]. Color temperature @ ~ 4,700K. Efficiency: 18-20 lm/W. CRI: 30. Originally intended as retrofit lamps for incandescent lamps since they do not require a ballast. These lamps are not used in Europe except sparingly. Calibration relative to [1.4.1]. | 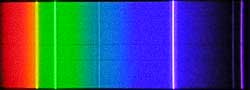 |
 |
| [1.4.5]: Self-ballasted High Pressure Mercury vapor lamp containing an incandescent filament in series with the Mercury discharge tube, as above, with yttrium vanadate phosphate fluorescent phosphors, utilizing many UV Mercury lines from NARVA [160W]. Color temperature @ ~ 3,400K. Efficiency: 25 lm/W. CRI: 74. Originally intended as retrofit lamps since they do not require a ballast, these lamps are still used both in Europe and in the States. Calibration relative to [1.4.1]. | 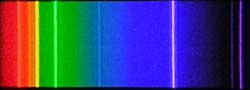 |
 |
| [1.5.1]: Taken during the warmup phase of a regular High Pressure Sodium lamp, at about 5-7 seconds after starting. Sodium D line, Mercury and xenon lines present. Calibration relative to [1.4.1]. | 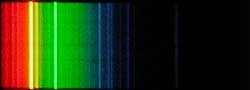 |
 |
| [1.5.2]: Also taken during the warmup phase of a regular High Pressure Sodium lamp, at about 10-12 seconds after starting. Sodium D and Mercury lines becoming stronger, xenon lines disappearing. Calibration relative to [1.4.1]. | 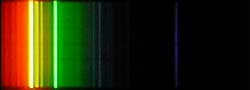 |
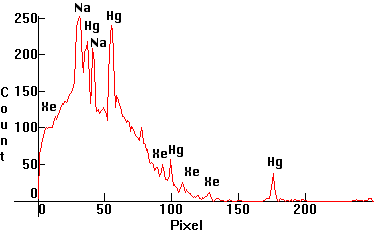 |
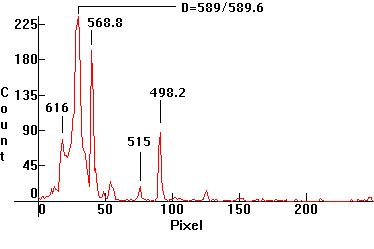
| [1.5.3]: Low pressure sodium discharge. Contrary to popular belief, sodium has many other emission lines, besides the famous D line, but they are very weak. These lamps are used when color rendition doesn't matter much and where/when there is a chance of bad visibility conditions, such as in tunnels, train crossings and shipyards, because visual acuity increases and vision becomes sharper under their almost monochromatic light. They are the most efficient light sources today, with a maximum efficiency of 210 lm/W (SOX-E 131W). CRI: 0-5. Calibration relative to [1.6.1]/[1.6.2]/[1.6.3]. | 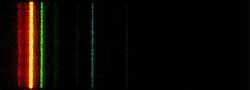 |
 |
| [1.5.4]: Medium pressure sodium discharge, taken during the warmup phase of a regular High Pressure Sodium lamp, at about 35 seconds after starting. Sodium D line is starting to self-absorb. Additional sodium lines becoming stronger. Calibration relative to [1.5.1]. | 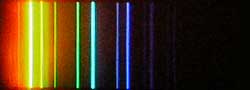 |
 |
| [1.5.5]: High Pressure Sodium lamp, from GE [Lucalox 35W]. Note complete self-absorption of the sodium D line and thermal broadening of additional sodium lines. Color temperature @ ~ 2,100K. Efficiency: 100 lm/W. CRI: 24. These lamps are the light source of choice for large public spaces because of their increased efficiency, therefore they are the most used light source for street, highway, garage, warehouse, shipyard, refinery, heavy industrial space and airport lighting. They are the foremost cause of light pollution, however. Calibration relative to [1.5.1]. |  |
 |
| [1.5.6]: Super High Pressure White Sodium lamp, from PHILIPS [SDW-T 100W]. Color temperature @ ~ 2,500K. Efficiency: 40-43 lm/W (according to [7]). CRI: 82. This is a high pressure sodium lamp which allows for higher pressure and temperature facilitating a whiter color than a regular yellow-gold high pressure sodium lamp, making it suitable for indoor applications where it can replace incandescent lamps. Compare with [1.5.5]. Calibration relative to [1.5.5]. | 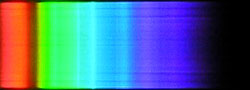 |
 |
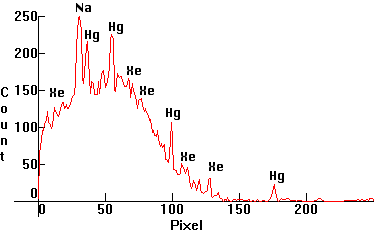
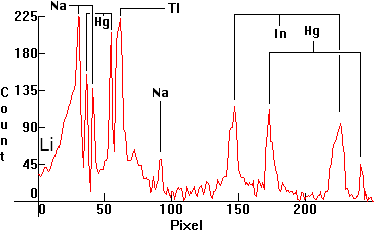
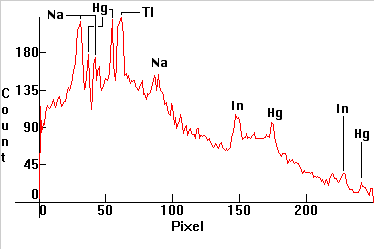
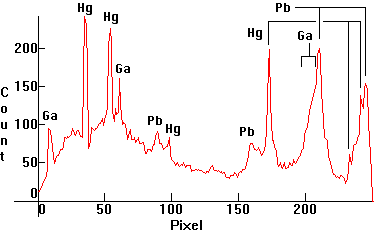
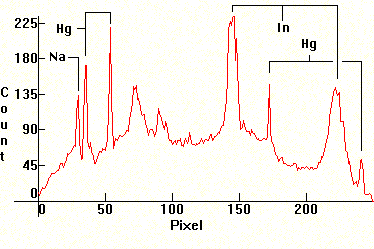
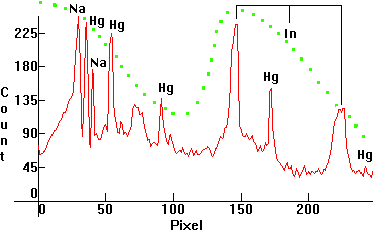
| [1.6.1]: Metal Halide lamp with Mercury, sodium, thallium, indium and (later) lithium iodides, from a (4-th generation) PHILIPS [HPI-T 400W]. Originally developed to be used for European sports and stadium lighting where color tv broadcasts took place (consequently the balance of iodides is such that the spectrum is especially suitable for color television broadcasts), but later these lamps found their way into large bay, shipyard, airport and highway lighting as well. Sodium is partially self-absorbing. Thallium line right of the Mercury green. Indium lines pressure broadened, left and right of the blue Mercury line. Lithium line barely shown, falling off the scale at 670nm. Color Temperature @ ~ 4,300K. Efficiency: 78 lm/W. CRI: 70. Calibration relative to [1.4.1]. | 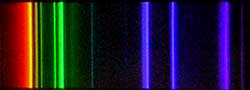 |
 |
| [1.6.2]: Metal Halide lamp with Mercury, sodium, thallium, indium and tin iodides, from OSRAM [HQI-TS 75W/WDL]. Sodium is partially self-absorbing. Thallium line right of the Mercury green line, as above. Indium lines pressure broadened, left and right of the blue Mercury line, as above. Continuum molecular emissions throughout from tin bromide. Color Temperature @ ~ 3,000K. Efficiency: 69 lm/W. CRI: 80. Used for indoor and outdoor applications in Europe, when/where a metal halide lamp with a warmer color approaching the warmth of incandescent lamps is desired. Calibration relative to [1.4.1]. | 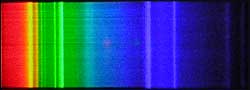 |
 |
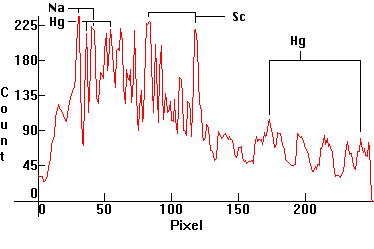
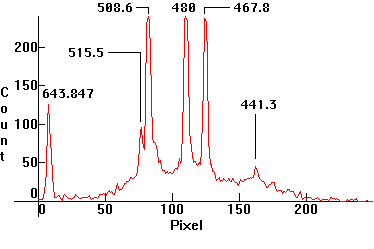
| [1.6.3]: Metal Halide lamp with Mercury, sodium and scandium iodides, from GE [MVR325IUWM 325 Watt I-Line Multi-Vapor Metal Halide - Clear Watt Miser]. Sodium is partially self-absorbing. Major Scandium lines at 474nm and 508-509nm. Color Temperature @ ~ 4,500K. Efficiency: 85-90 lm/W. CRI: 85. Used extensively in the United States for high bay, highway, warehouse, shipyard, stadium, parking lot, sports and airport lighting. Variations of these lamps with and without Mercury and with xenon as buffer gas are employed in car headlights on expensive cars, named "xenon headlights". Calibration relative to [1.4.1]. | 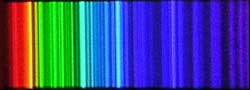 |
 |
| [1.6.4]: Metal Halide lamp with Mercury, thallium, dysprosium and caesium (and possibly holmium and thulium) iodides, from OSRAM [HQI-T 400W/D]. Mercury and thallium easily recognizable, as above. Color Temperature @ ~ 5,900K ([7] reports 5,900K for this, but on an equivalent Tunsgram, 6,900K. The author owns both and sees no difference in CCT visually). Efficiency: 68-74 lm/W. CRI: 90. These lamps are considered the best choice when color quality and high efficiency matter, such as for color matching facilities, in museums, stadiums, display store spaces, car sale yards, airports, warehouses, refineries and for the illumination of public monuments and buildings. Calibration relative to [1.4.1]. | 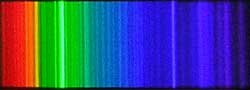 |
 |
| [1.6.5]: Diazo Metal Halide lamp with Mercury, iron and cobalt iodides from PHILIPS. Mercury lines easily recognizable. Contains some sodium as well for arc stability. Color Temperature @ ~ 7,000K. Small lamps using these additives are employed for sun-tanning applications since iron and cobalt emissions are useful for skin pigmentations. Lamps of larger power are more useful in the printing industry for the fast replication of blueprints and other diazo processes. Calibration relative to [1.4.1]. | 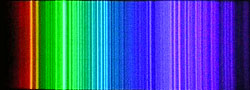 |
 |
| [1.6.6]: Diazo Metal Halide lamp with Mercury, gallium and lead iodides from Sylvania. Mercury lines easily recognizable. Some lead and gallium lines thermally broadened. Color Temperature @ ~ 9,000K. Efficiency: 23 lm/W (according to [7]). Used for reprographic printing applications. Calibration relative to [1.4.1]. |  |
 |
| [1.6.7]: Blue colored metal halide with Mercury and indium iodides from OSRAM [HQI-T 400W/Blau]. Indium lines pressure broadened and self-absorbed, left and right of the blue Mercury line. May contain traces of sodium for arc stabilization. These lamps are used for the decorative lighting of buildings, public monuments and for special effects illumination. Color Temperature ∞+. Efficiency: 18-20 lm/W (according to [7]). Calibration relative to [1.4.1]. |  |
 |
| [1.6.8]: Plant growing metal halide with Mercury, indium and sodium iodides from RADIUM [HRI-T 400W/Planta]. Indium lines pressure broadened, left and right of the blue Mercury line. Sodium is partially self-absorbing. The mixture of iodides in this lamp is especially suitable for plant growth, since its peaks closely match the photosynthesis curve of plants (shown in green). Although growth specialists often use alternatives such as [1.3.6], [1.5.5], [1.6.1] and [1.6.3], this lamp is specifically engineered for plant illumination and growth, hence is the best choice (details here). Efficiency: 62 lm/W. Calibration relative to [1.6.1]. |  |
 |
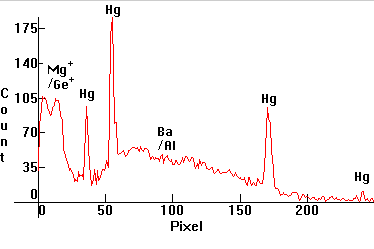
| [1.6.9]: Green colored metal halide with Mercury and thallium iodides from OSRAM [HQI-T 400W/Grun]. Two thallium lines are visible, the very strong green one right of the Mercury green line and a weaker red one, left of the sodium D line. May contain traces of sodium for arc stabilization. The light emitted by this lamp is practically monochromatic green, but the lamp is very efficient because the green thallium line is very close to the eye's maximum sensitivity area. Color Temperature @ ~ 7,350K. Efficiency: 88 lm/W (according to [7]). These lamps are used for the decorative lighting of buildings, public monuments, parks and for special effects illumination. Calibration relative to [1.4.1]. |  |
 |
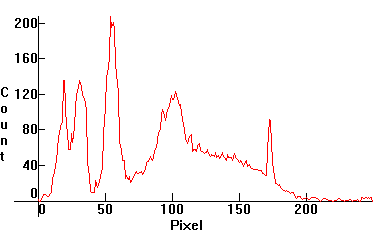
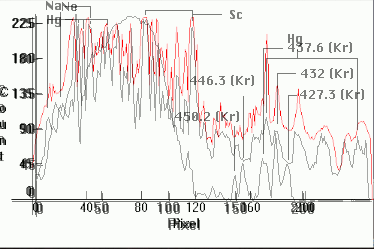
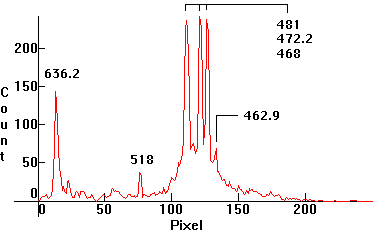
| [1.6.10]: Metal Halide lamp with Mercury, sodium and scandium iodides, from BLV [SIGNION HIE nw (neutral-white) duro 70-100-150 W]. Spectrogram (red) plotted against [1.6.3] and [1.9.2] (grey/black) for comparison. Note exact peak coincidences. Color Temperature @ ~ 4,200K. Efficiency: 88 lm/W. CRI: 70-80[24]. Calibration relative to [1.6.3]. Kr appears to be present (Box: "Contains traces of 85Kr and/or Th"). Other possible lines at 557nm (green) and 587 (yellow) very near the Hg 546nm and 577nm, too close to be reliably identified. Collaged superimposed distributions were center-shifted around the prominent Hg 435.8nm and Kr 432nm lines. Note that if this contains Kr, then so does [1.6.3] |  |
 |
| [1.7.1]: Regular high brightness blue LED. It has two spectral components: Blue emission from the GaAlN semiconductor, and a wide-band yellow emission from cerium activated yttrium aluminum garnet phosphor. Used in electronics. Calibration approximate, relative to [1.3.4]. |  |
 |
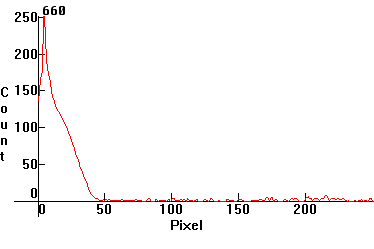
| [1.7.2]: Monochromatic emission from a red laser diode. The exact wavelength depends on temperature (therefore also on current) and may drift some, but generally it is in the vicinity of 660nm. Red laser diodes are used in optics and as instruction pointers. Calibration relative to scale [1.13.5] (approximate). |  |
 |
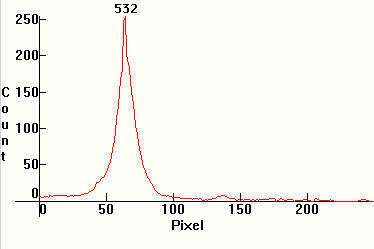
| [1.7.3]: Monochromatic emission from a green laser diode. Green laser diodes are the most common type of diode-pumped solid-state (DPSS) lasers and are used in optics and in amateur astronomy as star pointers. The most common DPSS laser in use is the 532nm wavelength green laser pointer. A powerful (>200mW) 808nm wavelength infrared laser diode pumps a neodymium doped yttrium ortho-vanadate (Nd:YVO4) crystal which produces 1064nm wavelength light. This is then frequency doubled using a nonlinear optical process in a KTP crystal, producing 532nm light. Calibration relative to scale [1.13.5] (approximate). | 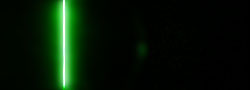 |
 |
| [1.7.4]: Stimulated short-shift Stokes fluorescence in denatured alcohol using [1.7.3] for stimulation. This alcohol is usually dyed using an aniline dye, which binds to 1,3-β-Glucan ([19], [20], [21], [22]), hence this radiation can be used to measure its concentration in the alcohol[2]. The radiation is visible at angles only perpendicular to the laser beam axis, hence it is coherent like that of the excitator. The spectroscope slit is about 1/2mm wide, that's why the green line is of finite width. Calibration relative to [1.7.3]. | 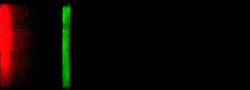 |
 |
| [1.7.5]: Typical Nichia-type cheap high brightness white YAG-phosphored LED with a blue-emitting LED die. Very likely zinc-selenide diode emitter. CRI: ~70. Color Temperature (estimated, based on [18]) @ ~ 7,000 - 8,000K. Used in light torches and cheap lighters for lighting effects. Calibration, relative to scale [1.13.5] (approximate, major peaks at ~450-460nm and ~560nm) | 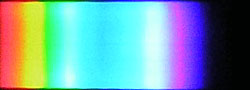 |
 |
| [1.8.1]: Continuous xenon low pressure thermionic discharge from a PHILIPS spectral xenon lamp. Used in spectral analysis. Calibration relative to [1.5.1]/[1.5.2], which reference xenon. | 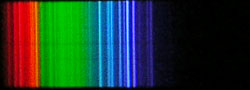 |
 |
| [1.8.2]: Continuous rubidium low pressure thermionic discharge from a PHILIPS spectral rubidium lamp. Used in spectral analysis. Calibration relative to scale [1.13.5]. | 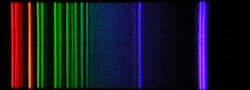 |
 |
| [1.8.3]: Continuous cadmium low pressure thermionic discharge from a PHILIPS spectral cadmium lamp. In 1927, the International Conference on Weights and Measures redefined the meter in terms of the red cadmium spectral line @643.847nm (1m = 1,553,164.13 wavelengths). This definition has since been changed and now krypton is used. Cadmium lamps which contain Mercury as well are used for spectroscope calibration, because the emissions contain a few distinct lines. Calibration relative to scale [1.13.5]. |  |
 |
| [1.8.4]: Continuous zinc low pressure thermionic discharge from a PHILIPS spectral zinc lamp. Used in spectral analysis. Zinc lamps which contain Mercury as well are used for spectroscope calibration, because the emissions contain a few distinct lines. Calibration relative to scale [1.13.5]. | 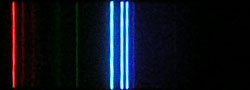 |
 |
| [1.9.1]: Neon glow discharge. Lamps with neon are used as night-lights and as indicators of operation of various electric/electronic devices. Calibration relative to [1.5.1]. (The Neon 585/588nm lines are very close to the sodium 589nm line). | 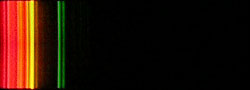 |
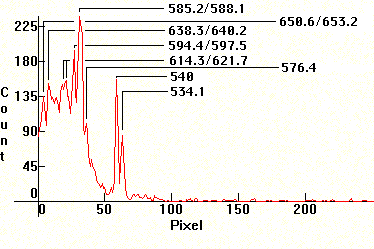 |
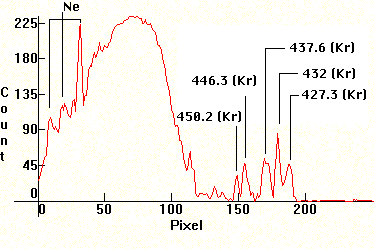
| [1.9.2]: Neon and krypton (according to [8]) glow discharge and green phosphor. Such lamps are used as night-lights and as electronic indicators. Calibration relative to [1.9.1]. | 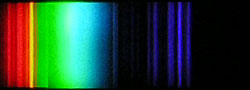 |
 |
| [1.9.3]: Neon and xenon (according to ref [8]) glow discharge and green phosphor. Such lamps are used as night-lights and as electronic indicators. Calibration relative to [1.5.1]/[1.5.2]. | 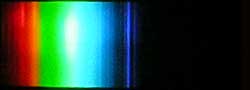 |
 |
| [1.9.4]: Neon and xenon (according to [8]) glow discharge and blue phosphor. Such lamps are used as night-lights and as electronic indicators. Calibration relative to [1.9.3]. | 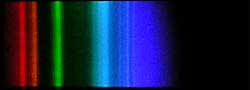 |
 |
| [1.9.5]: Argon glow discharge. Lamps with argon are used as spectrally pure sources for the emission spectrum of argon and for generation of long wave ultraviolet radiation. Calibration relative to [1.4.1] (Mercury: 404nm, Argon: 404nm). | 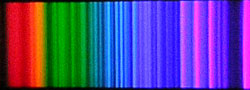 |
 |
| [1.9.6]: Self-ballasted High Pressure Mercury vapor lamp [1.4.3], with yttrium vanadate phosphate fluorescent phosphors, in glow discharge mode. The lamp was connected in series with a 7 kOhm resistor. Most of the light is produced by the yttrium vanadate phosphors. Calibration relative to [1.4.1]. | 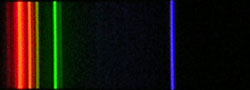 |
 |
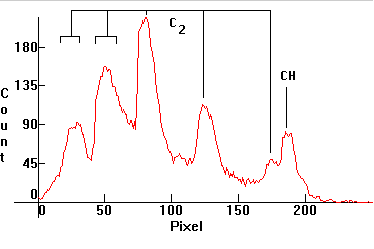
| [1.10.1]: Butane gas flame. CH and C2 molecular bands (according to [17]). Calibration relative to [1.10.2]. |  |
 |
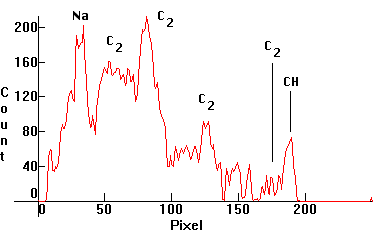
| [1.10.2]: Alcohol flame. Again CH and C2 molecular bands, since there is partial coincidence with the spectrum of a Butane burner, [1.10.1]. Also likely sodium (note probable sodium D line), from the cotton wick burning after a while. (This photo had to be heavily processed in Photoshop, as the original was underexposed, because of the low light intensity. This is 5 exposures with the spectroscope slit at maximum width stacked together). Calibration relative to [1.5.3] (Sodium D line). |  |
 |
| [1.11.1]: Print quality A4 Xerox paper wrapped around a blacklight lamp [1.13.2]. Calibration relative to [1.13.1]. |  |
 |
| [1.11.2]: "Neon Color" is a popular misnomer for certain popular fluorescent dyes. There is no actual neon involved here. The most famous such dyes are Red, Orange/Yellow, Green and Magenta. Green is usually found in dishwashing detergents. This is the green dye, bombarded with black light [1.13.2]. Calibration relative to [1.13.1]. | 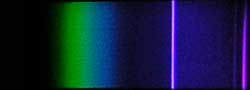 |
 |
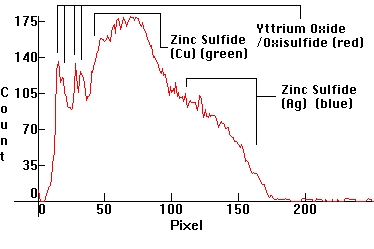
| [1.11.3]: Emissions from a regular modern color TV CRT. Red emissions by yttrium oxide or yttrium oxisulfide. The green phosphor is copper activated zinc sulfide, while the blue emitter is the same phosphor that has a silver activator in place of copper. These are the emissions from a SONY Trinitron CRT. Color temperature @ ~ 9,300K. Calibration relative to [1.3.4]. | 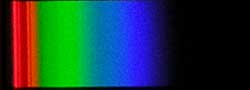 |
 |
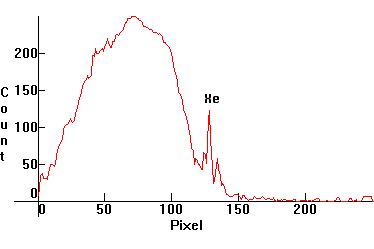
| [1.12.1]: Emissions from a stroboscopic flash. Xenon I, likely II and perhaps III. Color temperature @ ~ 5,500K. Efficiency: 25 lm/W. CRI: 95. They are the common electronic flash tubes employed in digital cameras and older electronic flash devices. High speed stroboscopic torch-lights are used for the visual testing and inspection of fast-moving mechanical parts. Calibration relative to [1.4.1] (Mercury: 491nm, xenon: 491nm). | 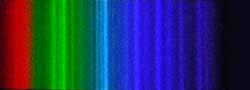 |
 |
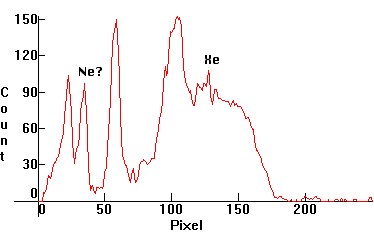
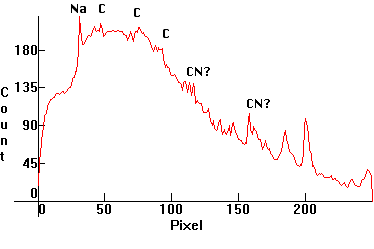
| [1.12.2]: A Carbon arc spectrum. A special arc was used, which kept electrode temperature low and allowed most radiation to originate from the arc. Carbon I emits a yellow line at 580nm but the line shown on the yellow area is more likely from sodium, as a contaminant. The carbon line is probably the yellow line just right of the sodium D. Additional carbon and CN lines shown on the green, blue and purple areas. Carbon arcs were used long time ago in search beacons and cinema projection but were gradually replaced by short arc xenon lamps ([1.12.3]). Color temperature @ ~ 3,000K. Efficiency: 15 lm/W. CRI: 95-100. Calibration relative to [1.5.3] (Sodium D line). |  |
 |
| [1.12.3]: Short Arc xenon lamp, from OSRAM [XBO 75W/2]. These lamps have excellent color temperature and CRI and light approximating in quality that of daylight. As such, lamps like these of higher wattages (in the 1kW-15kW range) are used in professional theater projectors, in search beacons and for one time night illumination, such as election campaign gatherings. Because of their excellent color, they are used for color testing and color matching. Unfortunately they require complicated support gear and their operation is dangerous, so they require dedicated personnel. Color temperature @ ~ 6,100K. Efficiency: 40 lm/W. CRI: 98. Calibration relative to [1.1.1] (approximate). |  |
 |
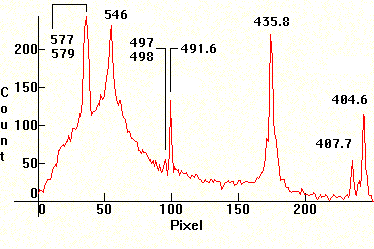
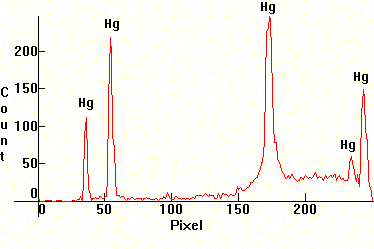
| [1.13.1]: Germicidal lamp, from Sylvania [G8T5 8W]. This is a low pressure Mercury vapor lamp with a buffer of argon. It is electrically identical to regular fluorescent tubes, but its envelope does not contain any phosphors inside and is made of special high purity glass with very low iron content. This low pressure mercury discharge emits roughly 78% of its radiation @ 253.7nm, which is strongly bacteriocidal, but also HIGHLY DANGEROUS to eyes and skin, so such lamps should be treated with extreme caution. Used for bacterial disinfection of air, water and general spaces in hospitals and warehouses which contain stuff sensitive to mould. Spectrum calibration: Reference. |  |
 |
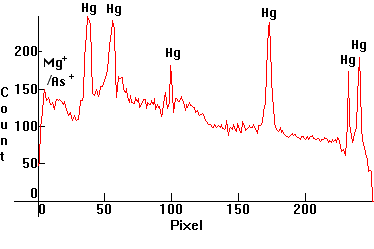
| [1.13.2]: Black light blue fluorescent, from Sylvania [F6T5/BLB 8W]. The tube consists of Wood's glass which filters out most of the visible radiation and is covered internally by an actinic fluorescent phosphor. These lamps are used for special fluorescence effects in discos and bars, detecting fingerprints in criminology, detecting counterfit banknotes in banking and for mineral fluorescence in mineralogy. Mercury, actinic phosphors (barium silicate activated with lead), utilizing the 254nm Mercury line and Wood's glass filter. Compare with [1.13.4]. Calibration relative to [1.13.1]. |  |
 |
| [1.13.3]: High Pressure Mercury Black Light from PHILIPS [HPW 125W]. This is a high pressure mercury lamp, whose outer bulb consists of Wood's glass which filters out most of the visible radiation, except the extreme red and extreme violet. The spectrum has been cut to fit the two extreme ends in one photo, consequently only the part right of the cut is calibrated relative to the other spectra and to the scale. Compare with [1.13.2], but note that in this case there is an additional continuum around the violet Mercury lines. Used for special effects, in criminology, banking and mineralogy. Calibration relative to [1.13.2]. |  |
 |
| [1.13.4]: Black Light fluorescent from Sylvania [Blacklite 350 F8W/BL350]. This is similar to [1.13.2], but without the Wood's glass envelope, so the visible Mercury lines are present. The actinic radiation of these lamps (the continuum on the right which peaks at UV around 350nm) attracts insects, consequently they are used in high voltage insect traps near meat counters in supermarkets, garden patios and other places where insects are a problem, such as kitchens and restaurants. Mercury, actinic phosphors (barium silicate activated with lead), utilizing the 254nm Mercury line and peaking around 350nm. Compare with [1.13.2]. Calibration relative to [1.13.1]. |  |
 |
| [1.13.5]: Approximate scale in nm for photos [1.1.1]-[1.13.4]. Generally, the calibration for the spectra containing Mercury was based on the green 546nm and 491nm lines (and whenever possible on the blue line), roughly around the middle part of the spectrum. In some cases, some edge lines are off, (especially towards the violet), mainly due to different focusing of the collimator while taking pictures. Whenever thermal or pressure broadening occurs on the high pressure discharges, the approximate middle of the broadened line was calibrated against the corresponding reference line. |  |
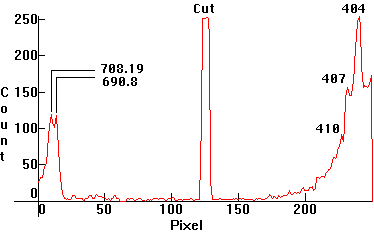
| [2.1]: The near visible UVA emissions from a high pressure Mercury clear lamp. Overexposure reveals many additional lines in the Ultraviolet. The camera's response went as far as 380nm. This is a composite from a color photo and a black and white photo processed in Photoshop. Color and black and white photo calibration using Black and white photos (photos 8 and 9) of Mercury UVA spectrum. | 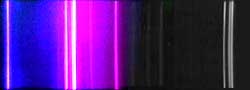 |
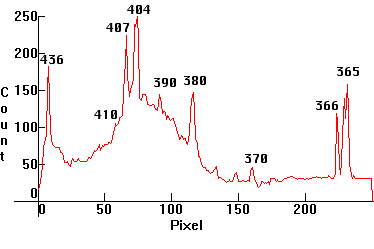 |
| [2.2]: Approximate scale in nm for photo [2.1]. Scale calibration relative to [2.1]. | 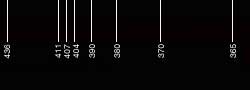 |
| [3.1]: High Pressure Mercury Warm Deluxe light ([1.4.3]) absorbed through blue Cobalt glass. Calibration: Reference. (Some overexposure near the blue/purple was unavoidable in order to capture the weak red emissions). | 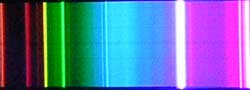 |
 |
| [3.2]: Incandescent light ([1.2.3]) absorbed through blue Cobalt glass. Note absorption between red and green. Calibration relative to [3.1] (absorption band between Mercury 546nm and 491nm lines). |  |
 |
| [3.3]: High Pressure Mercury Warm Deluxe light ([1.4.3]) absorbed through ciel dye #42053. This dye is used to color medicinal products such as mouthwash. Calibration relative to [3.1]. |  |
 |
| [3.4]: Incandescent light ([1.2.3]) absorbed through ciel dye #42053. Calibration relative to [3.3] (absorption band between yellow and red, approximate). | 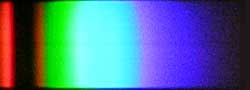 |
 |
| [3.5]: High Pressure Mercury Warm Deluxe light ([1.4.3]) absorbed through red glass. Note complete cutoff of emissions below yellow Mercury line. Calibration relative to [3.1]. | 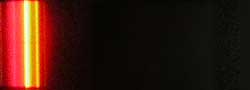 |
 |
| [3.6]: Incandescent light ([1.2.3]) absorbed through red glass. Calibration relative to [3.5] (approximate). |  |
 |
| [3.7]: Incandescent light ([1.2.3]) absorbed through olive oil. The spectrum has characteristic absorption bands in the red, yellow and green areas and displays complete absorption beyond green. Calibration relative to scale [3.8] (approximate). |  |
 |
| [3.8]: Approximate scale in nm for photos [3.1]-[3.7]. Calibration by shifting Mark's table [1.13.5] right and interpolating into the new region using the same interpolation function. | 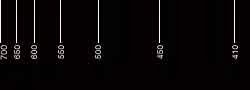 |
Recently the term 'full-spectrum' light bulb has shown up in marketing terminology. From the above list of spectra, which includes most of the light sources that are used for commercial lighting today, you can easily discern yourself that such a term has to be applied with caution: Take a good look at the Daylight spectrum [1.1.1], which is the only 'full-spectrum' spectrum, and try to locate another spectrum which matches it. You won't be able to, simply because all other spectra are by definition different. The only spectra that come somewhat close to it, are [1.2.1]-[1.2.5] and [1.12.3]. It is no coincidence of course these spectra are partial matches, since they come from 'black body' radiators (the same type as the sun). Yet even those sources lack in the blue and violet part of the spectrum. The spectra of "daylight" fluorescents ([1.3.1]), blue glass "daylight" incandescents ([1.2.5]), Dysprosium Metal Halides ([1.6.4]), high-voltage xenon ([1.12.1]) and short-arc xenon ([1.12.3]) are often considered good 'approximations' of daylight, although they either lack in the blue part or generate resonant frequencies which do not exist in the daylight spectrum. To conclude: The designation 'full-spectrum lamp', is usually a marketing gimmick used by companies to attract your attention as a consumer. Until an exact scientific definition for what constitutes a 'full-spectrum' is adopted by lighting engineers, there is no such thing, although an algorithm exists for calculating a so called 'full-spectrum' index, given a spectral distribution. For details see this document.
Spectra produced by gratings are always linear, so superimposing a linear scale below a spectrum photo and knowing two exact wavelength references is sufficient to create an exact wavelength table for the entire photo.
Spectra produced by crystal prisms are never linear (see scale [1.13.5] above), because the refractive index of transparent mediums usually varies with wavelength according to Sellmeier's Equation. Although many optics companies publish Sellmeier equation constants for their glasses, oftentimes the data is not available (like in our case). In these cases an interpolating polynomial can be used to approximate a usable scale. Given n+1 known visible wavelength references in a particular spectrum, a polynomial of degree at most n can be constructed, which can approximate the rest of the wavelengths.
For the double Amici prism spectroscope the polynomial used was calculated by Mark Widmer and is:
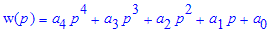
where:
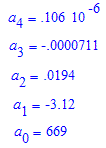
Consequently, given a pixel 0≤p≤249 on the above .jpg's, the corresponding wavelength will be approximately w(p). Conversely, given a wavelength 404.75nm≤λ≤669nm, the corresponding pixel p is found by solving the equation w(p)=λ(nm) for p, with the solution constrained into 0≤p≤249.
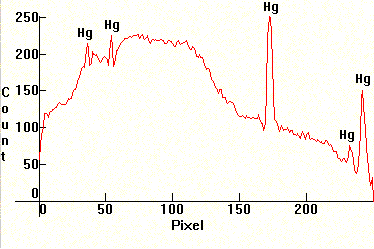
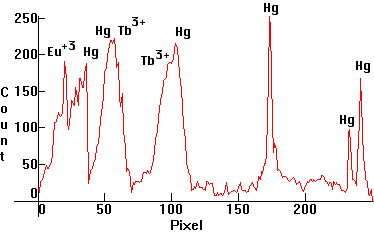
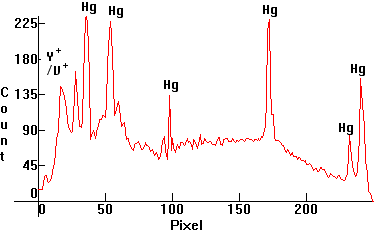
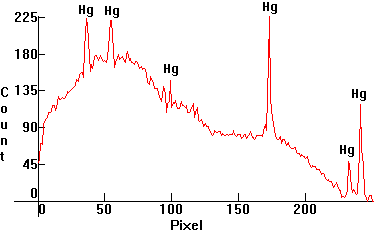
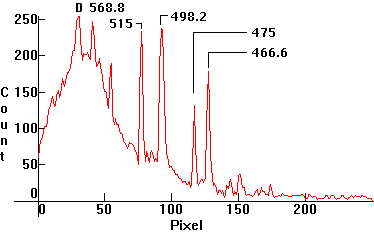
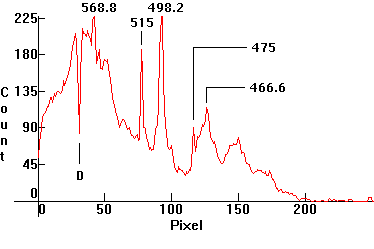
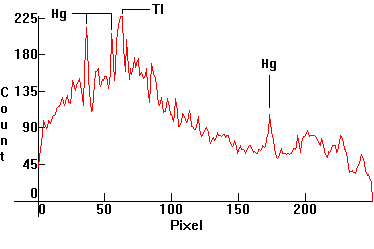
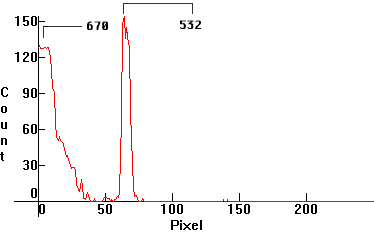
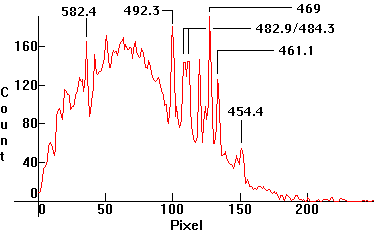
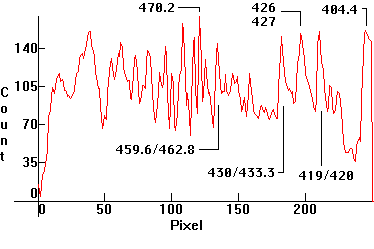
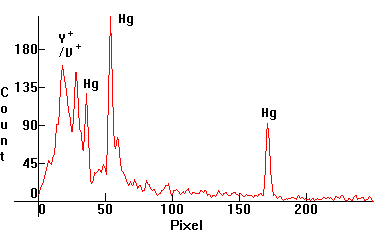
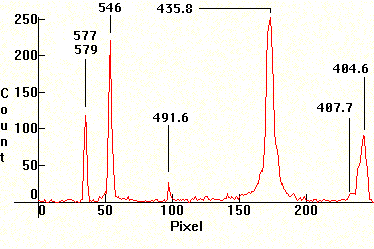
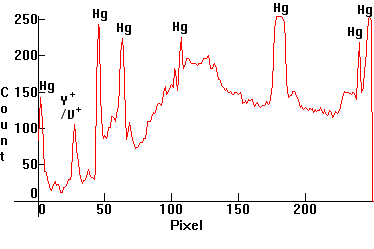
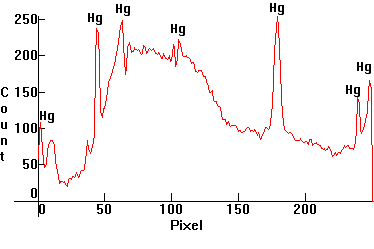
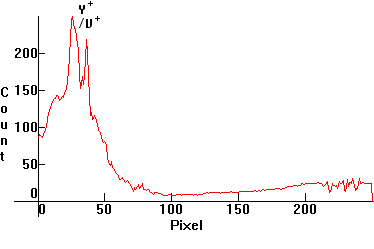
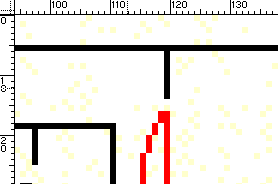
If one enlarges the .jpg for the thallium spectrum [1.6.9] in Photoshop for example, using Maple to numerically calculate the solution of the equation w(p)=535nm for p, the thallium green line shows approximately at pixel p = 61. Conversely, the above polynomial gives w(61)=536.19671nm, which is very close to the wavelength of the green thallium line at 535nm.
The transformation which gives the correspondence between a spectrum .jpg pixel and a distribution .gif pixel to the right, is pgif=335/249*pjpg+39. Accordingly, the peak of the thallium green line at pixel pjpg=61 on the .jpg [1.6.9] shows on the .gif to the right as pixel pgif=121.
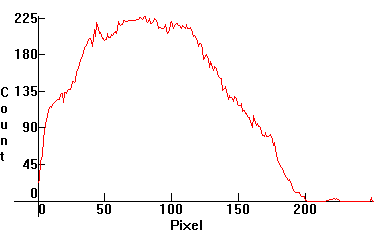
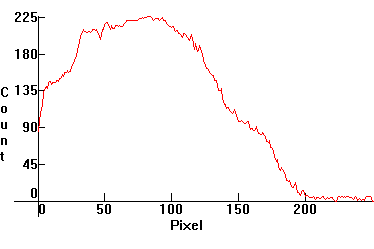
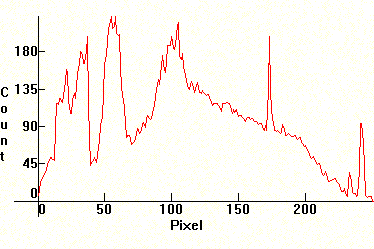
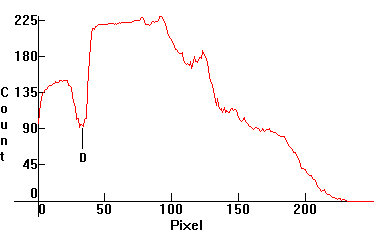
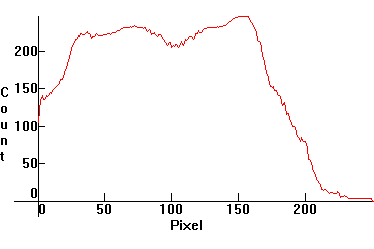
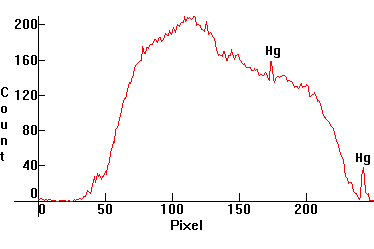
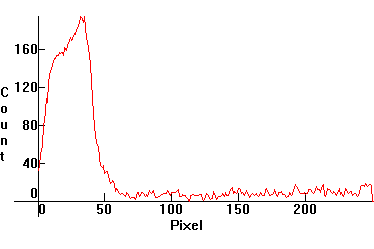
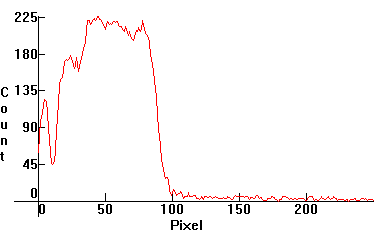
Relative spectral intensity needs to be calibrated too, because the camera's major sensor sections are not calibrated against each other. To calibrate the intensity, we need to compare a measured spectrum against one we know is correct. We know the Sun is approximately a black body source, so we choose the Daylight spectrum, which is the spectrum of approximately a radiating black body at an effective T=5785K.
We then first generate the corresponding black body distribution with Maple, using the coordinate transformation BB(w(p(gif))), where BB is the black body distribution and w(p) is the interpolating polynomial, above:
> BB:=proc(T,lambda)
> local lambdam,bbu,bbn;
> lambdam:=lambda*10^(-9);
> bbu:=(3.74183*10^(-16)*lambdam^(-5)/exp(1.4388*10^(-2)/(lambdam*T))-1.0); #black
body distribution
> bbn:=bbu/.8278970270e14*224; #normalize intensity and multiply by experimental
max.
> end:
> with(plots):
> plot(BB(5785,w(p)),p=0..249);
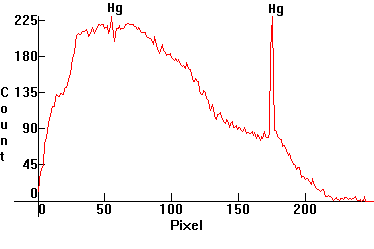
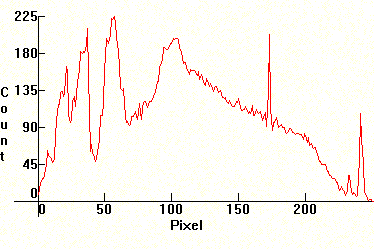
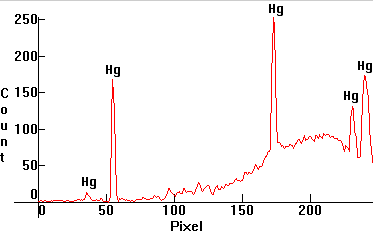
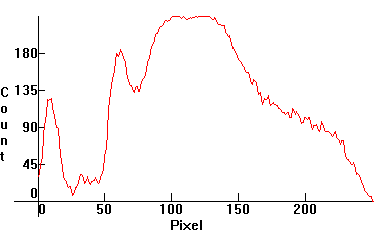
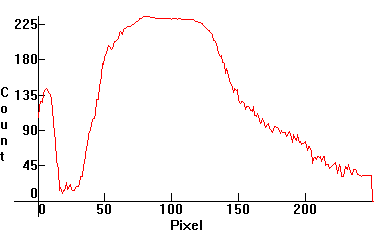
By the Intermediate Value Theorem, some non-zero measure interval will be already calibrated. We then graph both the experimental and theoretical curves. The resulting graph is:
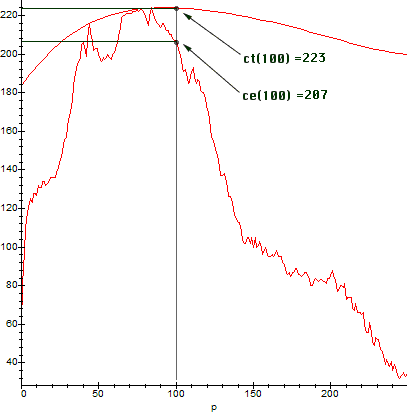
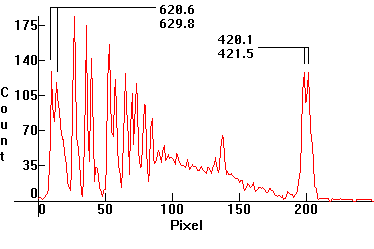
The calibrated intensity section then, falls approximately between pixels 65-90, because we have a good match there. Once we identify the calibrated section, sections which deviate from the black body curve can be calibrated for intensity by simply multiplying the corresponding experimental intensity ce(p) by a suitable count-correction factor cc(p). To calculate cc(p), we look at the counts on the above graph. For example: ce(100) = 207, while the correct theoretical intensity count should be ct(100) = 223. Therefore, for the pixel p = 100, the corresponding cc will be exactly equal to cc(100) = ct(100)/ce(100) = 223/207 ~ 1.081591650.
Once we find cc(p), for all p in [0..249] on the above graph, we need to adjust the corresponding .gif distribution by applying the transformation ccc(p) = ce(p)*cc(p).
Note that when the spectrum source is mostly discrete, the cumulative error from non-calibrated spectra is mostly negligible because the distribution function is almost singular, hence is of minor importance when comparing spectra. When the spectrum source contains large continuous emissions or is purely continuous, however, this error may build up and may distort the overall appearance of the source in subsequent comparisons or calculations which are based on those distributions.
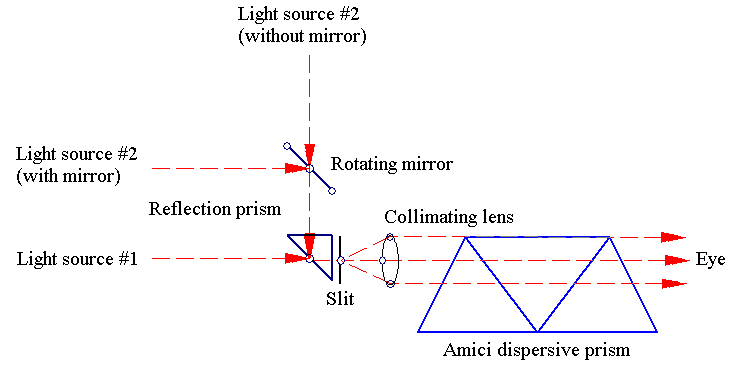
Whenever a spectrum could not be calibrated directly relative to an existing reference, a visual calibration was performed based on an alternate light entry point of the spectroscope. A small total reflection prism sends a vertical incident ray into the slit with or without the aid of an auxiliary mirror. Then, the spectra of two different light sources can be seen simultaneously, thus their relative positions can be matched by inspection. That was how the spectra which did not have direct references above were calibrated.