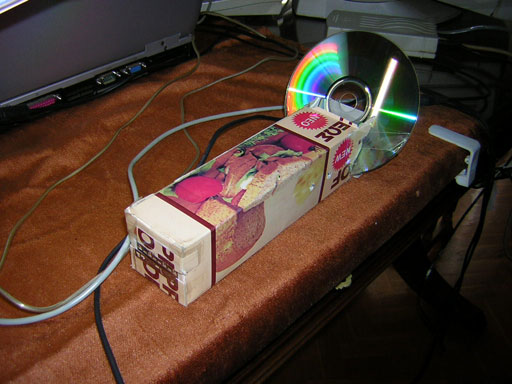
A toy spectroscope using a CD or DVD as a grating, can be built easily. This design is based on the CD Spectrometer page by Jerry Xiaojin Zhu. The author was curious how well this spectroscope would perform, so he set forth to build one.
The technical specs of this toy spectroscope are very simple: It uses a CD/DVD as a dispersion grating and a slit made of two shaving blades, mounted on paper. The viewer is simply the human eye at an angle of ~90 degrees relative to the incoming light. The CD has roughly 600 lines per mm, so the resolving power is roughly 600 x 40mm (covered track radius on average) = 24,000. That's not bad! That's almost twice as high as the resolving power of the Phasmatron spectroscope around the area of the Sodium D lines!
Here are some spectra photographed through this toy spectroscope and a Nikon CoolPix digital camera and processed with Photoshop.
| Light Type | Visible Spectrum |
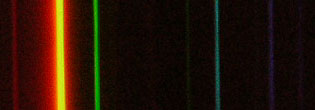
| [1]: This is the spectrum of a high pressure Mercury fluorescent lamp. Not bad! The yellow lines are almost resolved! All the lines are visible, although there are many artifacts, mainly showing as ghosts right of the spectral lines. The ghosts occur because of multiple reflections between the front and back side of the CD. Note that the dispersion is now linear, contrary to the dispersion from prisms, which is non-linear. | 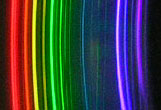 |
| [2]: The spectrum of a high pressure Mercury fluorescent lamp, same as above, but with the camera zoomed to its limit. Again, all the lines are visible, but the ghosts and artifacts make it difficult to differentiate between what is real and what's not. | 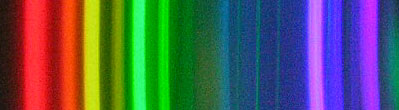 |
| [3]: Same spectrum as above, this time with the slit closed somewhat more than in [1] and [2]. Note that yellow lines are starting to resolve, but overall brightness diminishes greatly. Note multiple artifacts of the green Mercury line. | 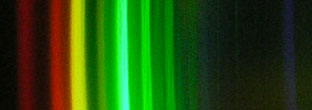 |
| [4]: Same spectrum as above, this time zoomed on the red fluorescence area. The intensity of the green artifacts has diminished, but they still show pretty badly. | 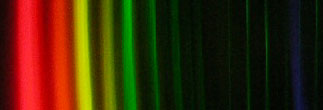 |
| [5]: Same spectrum as above, with the slit closed even more. The two yellow Mercury lines are now clearly resolved, but the artifacts are still there. | 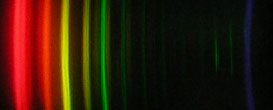 |
| [6]: The spectrum of a CFL 4,000K triphosphor fluorescent. It's not bad, but the toy spectroscope still generates lots of artifacts which interfere with the actual spectrum lines. The artifacts here are of two kinds: Artifacts from internal reflections between the CD sides and artifacts from second order spectra. | 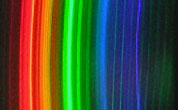 |
| [7]: Same spectrum as above [6] at a slightly higher magnification, obtained by zooming the camera in. | 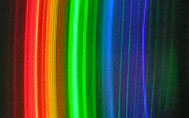 |
| [8]: Same spectrum as above [6] at a still higher magnification. The two kinds of artifacts are now easily recognizable. | 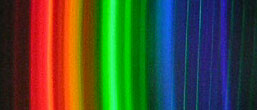 |
| [9]: Same spectrum as above [6] at the highest magnification the camera allows. Unfortunately, at this magnification the camera is not able to focus properly, so this image doesn't do the toy spectroscope much justice. | 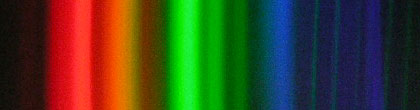 |
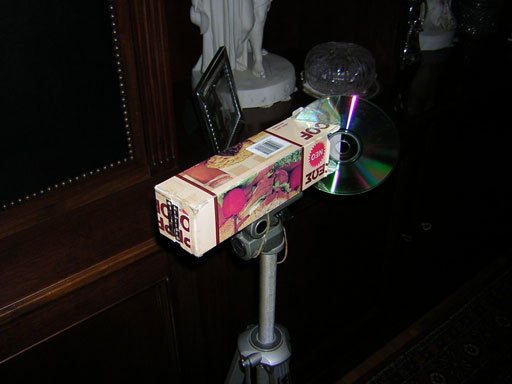
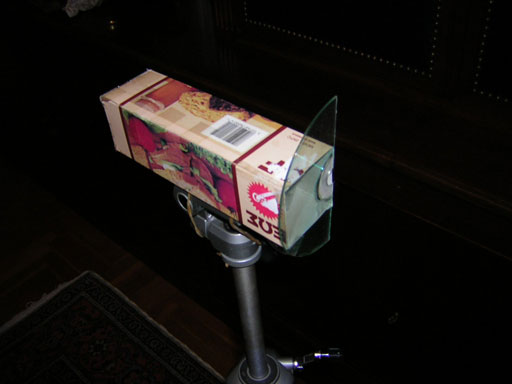
Ok, so this toy spectroscope can't perform up to lab standards. This was expected. A CD grating is very poor quality compared to commercial quality gratings[1]. Can we now improve the situation a bit? Yes, we can! We can transform the CD from a reflection grating to a transmission grating! That way, reflection artifacts will most likely be gone (we hope). Let us then perform a little surgery on that CD disk:
We now have a transmission grating spectroscope! Here's what it looks like:
As mentioned above, CD disks have roughly 600 lines/mm, so the grating constant is in this case: d=10-3/600=1.66*10-6m. DVDs have roughly 1351 lines/mm, so the DVD grating constant is d=10-3/1351=0.74*10-6m, so using a DVD is even better! Incidence is perpendicular to the grating, so we apply the formula d*sin(θ)=k*λ. For the green Mercury line, λ=546*10-9m, and k=1 for the first order spectrum, =>θ=arcsin(546*10-9/1.66/10-6) ~ 19.2°.
Improved Color Spectrum Photos
| Light Type | Visible Spectrum | Spectral Distribution |
| [1]: The spectrum of a High Pressure Mercury Vapor fluorescent lamp, through the improved CD spectroscope. Excellent! The artifacts are gone now and the spectrum is nicely discernible. | 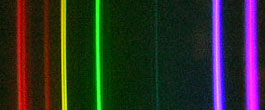 |
 |
| [2]: Same as above, at a slightly higher magnification. Note that not only there are no artifacts, but the weak 491nm Mercury doublet is nicely visible. | 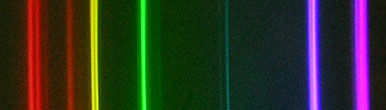 |
 |
| [3]: Same as above, upping still the magnification a bit. Note that the yellow Mercury doublet easily resolves. | 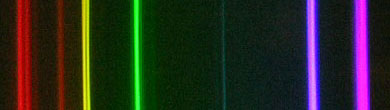 |
 |
| [4]: The spectrum of a CFL 4,000K triphosphor fluorescent. Not bad at all! All artifacts are now gone and the terbium/europium and Mercury lines are clearly visible. | 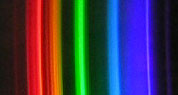 |
 |
| [5]: Same spectrum as above [4] at a slightly higher magnification, obtained by zooming the camera in. | 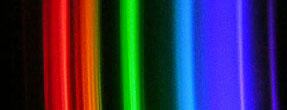 |
 |
| [6]: Same spectrum as above [4] at a still higher magnification, at a lower exposure to reveal the Mercury yellow doublet, which is clearly separated by thin dark space. | 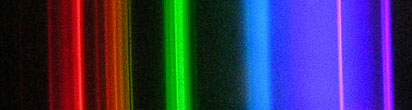 |
 |
| [7]: Same as above at still higher magnification. | 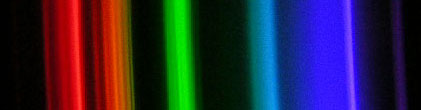 |
 |
| [8]: Spectrum [4] at the highest magnification the camera allows using a digital zoom. At this magnification the camera is not able to focus exactly, but all the major features of the CFL spectrum are visible still. | 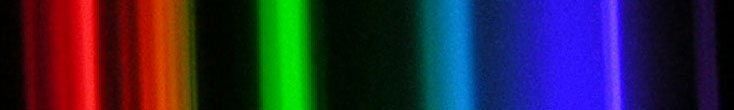 |
Note that with a regular CD, the theoretical resolution of the grating would be: Δλ = λ/(k*N), where λ is the wavelength, k is the order of the spectrum and N is the total number of lines. For the CD grating we have, the grated radius is 4cm = 40mm, so N = 40*600 = 24000, which means: Δλ = 5893/(1*24000) ~= 0.24 A, for the first order spectrum. In principle then this spectroscope can resolve the sodium D line, since the difference between D1/D2 is 5.97 A. Let's see then: