 |
 |
Left is always red, right is violet. Spectrum length varies according to picture. These are photos on black and white panchromatic film, which has a smoother response to most wavelengths. Wavelengths are nm on photos with the small spectroscope and Angstroms on photos with the Phasmatron spectroscope[1][3].
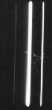
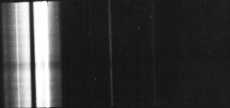
First the plain spectrum of a Low Pressure Sodium vapor lamp. The lamp is the Philips SOX-T with Indium Oxide coating, at 35W. Contrary to popular belief, the spectrum of Sodium is neither monochromatic nor simple in general. Most of the lines are clusters of doublets. The three lines below are all doublets that are really hard to resolve. They are from left to right: 6160A/D/5688.224A. You will see the D lines resolved further down.
|
|
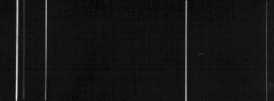
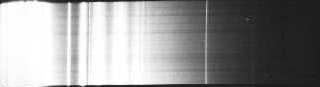
Next the spectrum of a High Pressure Sodium vapor lamp. It is that of a SON-T clear High Pressure Sodium. The lamp has not warmed up yet, and the Mercury lines from the Mercury/Sodium amalgam are visible as well. The leftmost line is that of Sodium and the rest are of Mercury.
 |
 |
Next the spectrum of the same lamp above, except that the lamp is warmed up. Note the self-absorption around the Sodium D lines[2]. It also happens to other lines, but it is most visible around the D area.
 |
 |
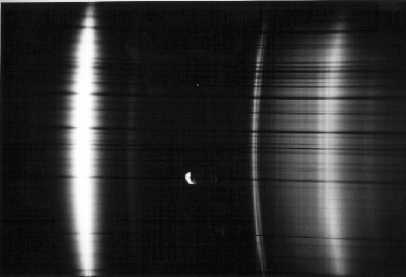
The next photo is the same spectrum (High Pressure Sodium) overexposed so that additional Sodium lines can be seen, as well as the continuum that comes from ionization. The last line to the right is the blue line of Mercury.
 |
 |
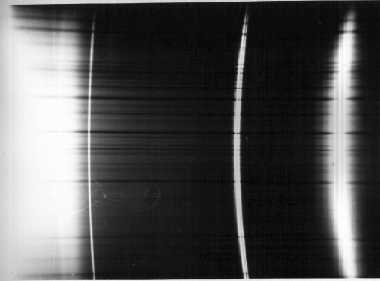
Follow the same spectrum photographed through the Phasmatron spectroscope, at magnification 8x. Note the banding that occurs to the most prominent Sodium lines to the right. The area around the D1/D2 is almost continuous. This area accounts for most of the lamp's emissions and its particular gold color.
 |
 |
 |
 |
 |
 |
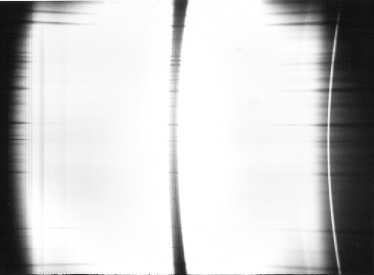
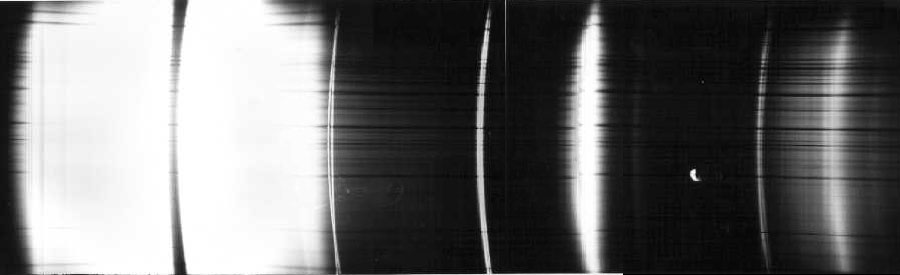
Follow the above three photos stitched into a "mosaic", showing the entire range of the High Pressure Sodium spectrum.
 |
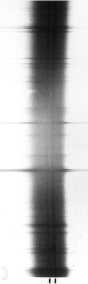
Finally, the Sodium D1/D2 area, photographed through the Phasmatron, at magnification 24x. You can clearly see the D lines resolved (marked below for reference).
 |
 |